OpenTelemetry & Observability Stack
OTel Architecture Loop
As Saffira Admin scaled to multi-tenant operations, maintaining high availability required moving beyond simple Prometheus metrics. We needed an integrated observability pipeline providing unified Metrics, Traces, and Logs to diagnose unexpected latency spikes and service errors instantaneously.
Here is how we refactored the legacy Prometheus stack into an end-to-end OpenTelemetry (OTel) pipeline—instrumenting NestJS services, pushing signals through an OTel Collector router, and embedding trace-to-log correlation in Grafana.
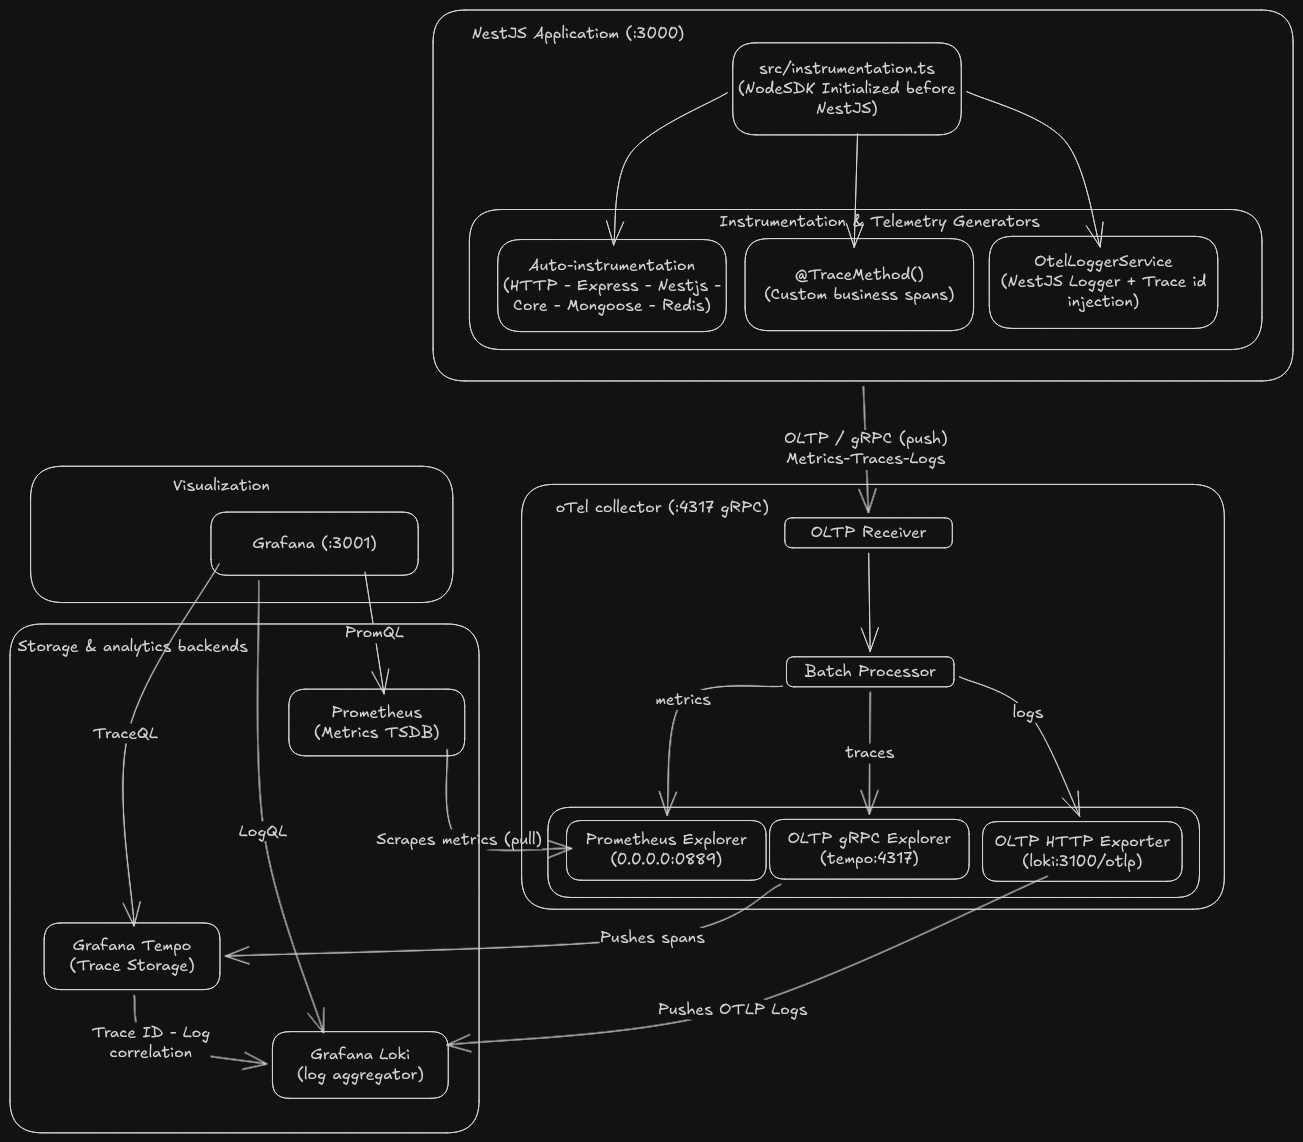
Figure 1.1: Saffira Admin OpenTelemetry & Observability Architecture Map.
Interactive Signal Routing Pipeline
Explore the interactive map below to see how application telemetry flows from Node.js runtime initialization down to Grafana storage backends:
Initialized synchronously prior to NestJS factory creation. Configures global OTel resource attributes, gRPC exporters, and patches core Node modules.
Patches Express, HTTP, NestJS Core, Mongoose DB queries, and Redis commands out of the box.
Custom method decorator starting active child spans around business logic with exception recording.
Replaces default NestJS Logger. Extracts active trace_id and injects it into logs.
Figure 1.2: Interactive OpenTelemetry signal routing map with application bootstrap, OTel collector pipeline, and storage correlation.
Instrumentation & Business Metrics
1. Line 1 SDK Bootstrap (`instrumentation.ts`)
To ensure zero un-instrumented HTTP requests or database operations, OpenTelemetry's NodeSDK is loaded on the very first line of main.ts before NestJS module compilation:
- Auto-Instrumentations: Enables automatic tracing hooks for Express, HTTP, NestJS Core, Mongoose DB queries, and Redis commands.
- Graceful Shutdown: Registers process signal handlers (
SIGTERM/SIGINT) to flush remaining in-memory batches to the Collector prior to process exit.
2. `@TraceMethod()` Decorator & Custom Business Meters
While HTTP status metrics indicate general route throughput, business events (such as password mismatches returning HTTP 200 or asynchronous 2FA email delivery failures) require targeted instrumentation.
@TraceMethod(): Custom method decorator wrapping business logic inside active OpenTelemetry child spans, capturing method parameters and recording exceptions automatically.- Business Counters: Uses
metrics.getMeter('saffira-admin-business')to expose explicit counters:- •
auth.login.attempts— Login outcomes by result (successvsfailure) - •
auth.2fa.dispatch— 2FA email delivery success/failure - •
connection.operations— Lifecycle actions (created,updated,deleted) - •
user.operations— User management CRUD actions
- •
3. Trace-Correlated Logger (`OtelLoggerService`)
We implemented a custom NestJS OtelLoggerService that inspects the active OpenTelemetry context during log generation. It extracts trace_id and span_id, printing trace-tagged stdout strings for container log drivers and emitting structured OTLP log records directly to Loki.
3-Tier Grafana Flow
To empower less technical IT support and helpdesk personnel, we structured the Grafana dashboard into a 3-tier progressive disclosure flow—enabling root-cause analysis in under two minutes without requiring complex PromQL or LogQL query knowledge.
Top traffic-light stat cards showing Backend Status (Online/Offline), Error Rate % (5xx HTTP responses), Avg Response Time, and Requests Per Minute.
Collapsible domain panels visualizing Authentication (login outcomes & 2FA dispatch), Edge Detector Connections, User Management, and Database Latency.
Embedded Loki error feed displaying plain-English messages. Clicking any log entry exposes a clickable TraceID link jumping into Tempo waterfalls.